
The ultimate goal of creating a linear regression is to make predictions with it. Linear regression is a regression model that predicts numeric values.
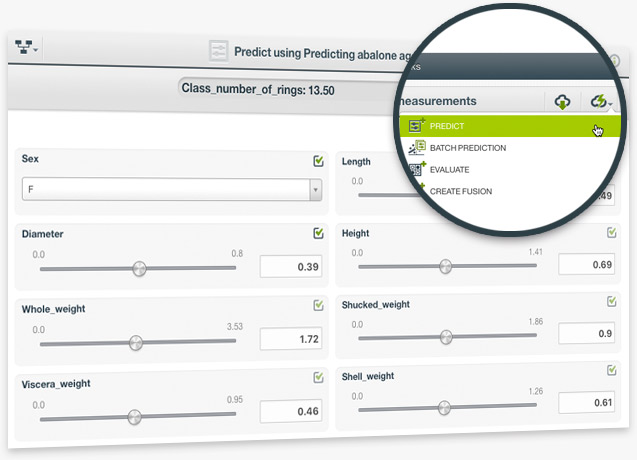
You can perform single predictions with linear regression, if you want to predict just one instance. This is easily achieved by using BigML prediction form —just input the values for the fields used by the linear regression. You can also ask for the prediction explanation, i.e., the per-field importance in the prediction.
BigML batch predictions allow you to predict multiple instances with one-click. Just select the linear regression and the dataset containing the data you want to predict, and BigML will automatically generate an output CSV file with a prediction for each of your instances. A wide range of the output file settings can be configured. Learn more about linear regressions here.
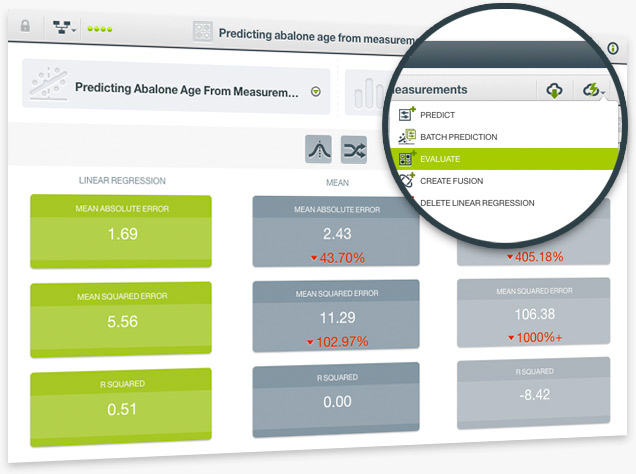
Evaluate the performance of your Linear Regressions to get an estimate of how good your model is at making predictions for new data. As with other supervised regression models, the resulting performance metrics of linear regression evaluations includes three measures: Mean Absolute Error, Mean Squared Error and R Squared. BigML also provides the measures of two other types of models to compare against your model performance. You can find explanations for these measures in the documentation.
BigML adds Linear Regression to our collection of supervised learning methods. Linear Regression is a well known algorithm that discovers relationships between input fields and the objective field. BigML’s implementation can support any type of field, including numerical, categorical, text, items fields, and can even handle missing values.
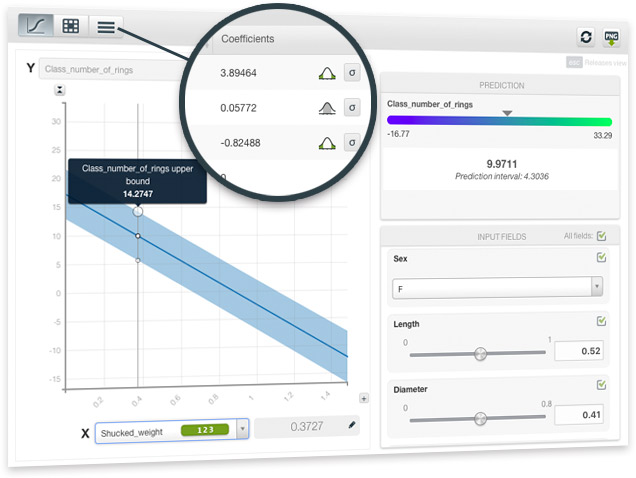
BigML Visualization for linear regression includes three views: a 1D chart, a Partial Dependence Plot (PDP) and a coefficient table. The 1D chart and PDP provide visual ways to analyze the impact of your input fields on predictions. The table shows all the coefficients learned for each of the variables of the linear function, which is useful for inspecting model results.
Learn more about Linear Regression on the release page.